Social Housing Cost per Unit - Scenario Modelling
Scenario modelling provides a quick way to explore the impact of changing the levels of the different explanatory factors. The three charts show the current actual value and the predicted value and alternative scenario values, along with their confidence limits. Initially the Predicted Value and Alternative Scenario will be the same (ignoring any minor rounding adjustments).
As described in the overview we are able to apply the equation to any set of underlying values. The aim of this page of the report is to enable the user to explore the impact on their predicted cost of changing any of the five explanatory factors, such as the proportion of supported housing, or increasing expenditure on major repairs. Note that for major repairs, we have summed the amount on Major repairs expenditure and Capitalised major repairs expenditure.

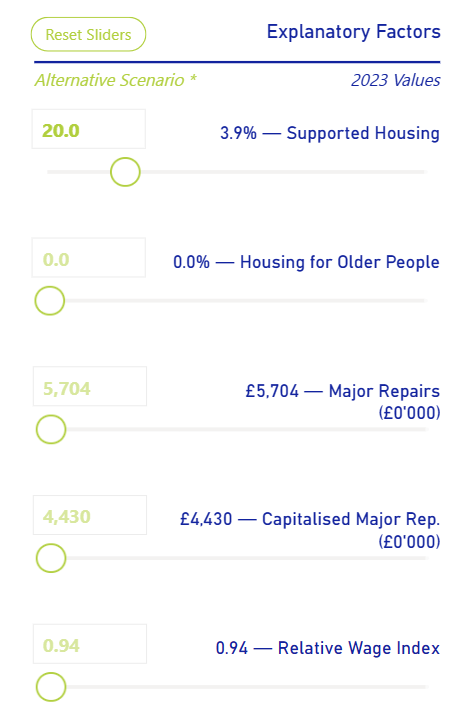
Either type a new value of one of the explanatory factors into the appropriate box, or use the slider, to set a new value and observe the impact on the Alternative Scenario chart.
Enter the actual budget that might be relevant for Major Repairs, or Capitalised Major Repairs. These are summed and divided by the number of units in the model.
These values can be reset using the reset button and go back to the reported values for the selected provider.
The Upper and Lower prediction intervals show how robust the estimate is, there is always potential for some random effects that are not captured by the model and the intervals are approximations of that variability.
The model is a log - linear model so the relationship between the factors and SHCU is not linear.
Changing the relative wage index would only be appropriate if stock were acquired in very different areas of the country.