Disability Estimates
Overview
Many housing providers are aware that the details that they have in their data may massively underestimate the true level of disability within their resident population. This inference might be drawn from the House of Commons Library Research briefing entitled ‘UK disability statistics: Prevalence and life experiences’ (July 2022) which provides an overview of expected disability rates. These rates may well be much higher than the recorded disability amongst a resident population. The briefing points to the most useful resources for measuring disability, namely benefits data, census data and the Family Resources Survey (FRS) from the Office for National Statistics and it is the latter which we exploit in this dashboard.
The FRS is ‘considered the primary measure of disability prevalence in the UK. FRS disability estimates are based on respondents self-reporting “a physical or mental impairment” which has “a substantial and long-term adverse effect” on their ability to carry out day-to-day activities, in accordance with the Equality Act 2010 definition (p6, in House of Commons Report).
Detailed analysis can be used to provide robust (statistically valid) estimates of the likely level of disability within any resident population by using the FRS to generate estimates for a population that is as close as possible to that population. Note that we use the terms ‘difficulty’ and ‘disability’ interchangeably, reflecting their use in the different sources.
The dashboard consists of just two pages:
a simple national overview of the social housing population showing disability rates and numbers, by types of disability, region, age band and gender
a page to enter the number of residents (including children) and obtain an estimate of the predicted disability numbers, i.e the number of residents that might be expected to have specific types of difficulty, according to the region, age and gender
Social Housing Population
The bar chart and table on the left of the page show the estimated rate of the different types of difficulty by age band. They are based on the data from the Family Resources Survey and estimating a logistic regression independently for each type of difficulty.

The level of accuracy can be understood by turning on the prediction limits, via the button above the chart. These prediction intervals show that we can be 95% confident that the true value for the whole population (i.e. not just the survey respondents) is somewhere between these values.
The estimates are based on two of the six housing tenure types in the survey, namely Rented from Council and Rented from Housing Association. These have very similar rates and the survey documentation suggests that many residents are not aware of the distinction, hence we have grouped them to help ensure a good sample representation.
The bar or table row that refers to ‘At least one difficulty’ means those who have recorded one or more difficulties. Many respondents to the survey would have had two or three difficulties, so the number of people with difficulties is not simply a sum of all the different types of difficulties.
In the survey, respondents were asked the question: ‘Does the condition limit day to day activities?’. We have restricted our analysis to those who find that their condition limits their day to day activities ‘a lot’, as opposed to ‘a little’ or ‘not at all’.
The page also shows the total social housing population by region (as estimated by using the population grossing factors in the survey) and the social housing population with the selected difficulty. These are the tables on the right of the page.
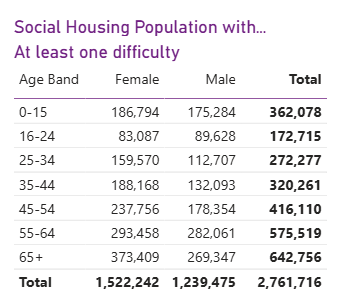
the estimates for each difficulty by gender and age band. Click on the Male or Female column.
Predicted Disability Numbers
The original goal of this project was to generate a straightforward number which enabled a social housing provider to estimate how many residents were likely to have a difficulty based on government social survey data, in this case the Family Resources Survey. Using the logistic regression that sought to understand the predictors of whether or not an individual had one of several difficulties, we were able to create a predicted rate by age band and gender that was specific to each region.

We invite the user to enter the number of residents (including children in this number). This number is then distributed across the age bands and genders according to the age / gender distribution of the regional population (as derived from the same survey which uses the Office for National Statistics grossing factors derived from the Census). These numbers can be seen in the main table and also illustrated in the chart.
It is helpful to have some idea of the accuracy of these predictions and that can be seen by showing the limits. The limits indicate that we are 95% sure that the true number of residents with each class of difficulty is between those limits. The lower and upper limits will appear in the table as well as the chart.
To view a specific age band in the chart, simply click on that column in the table above.


To download a table, the easiest way to do this is via the export feature of Power BI. Simply click on the three dots shown on the top right of most visuals to open up the extended menu. Select Export data. This will export data in a format that can easily be re-summarised via an Excel pivot table.
Also, if a population that exists over more than region, it is possible to download two tables, one for each resident sub-population and then combine them in Excel.
Family Resources Survey, 2023-2024. [data collection]. UK Data Service. SN: 9367
Department for Work and Pensions. (2025).